hobrien.github.io
Shiny Web Apps
Hello Shiny
library(shiny)
runExample("01_hello")
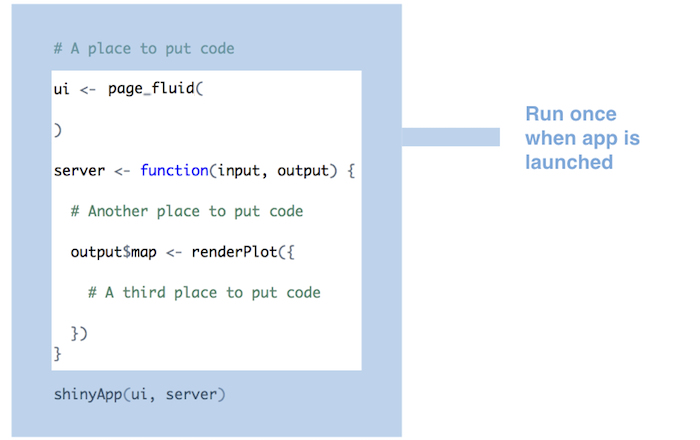
Anatomy of a Shiny app
- ui function (or ui.R file) controls the layout of outputs and how inputs are collected
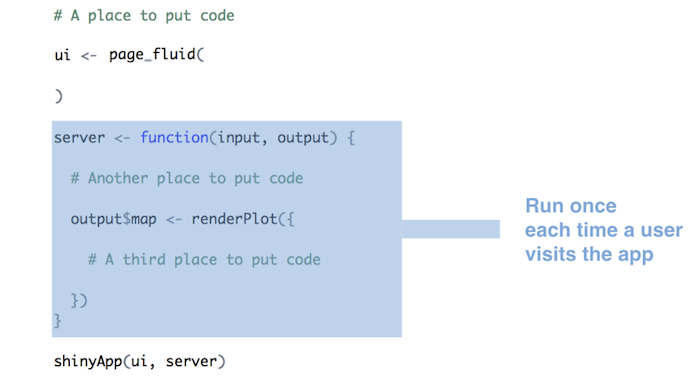
- server function (or server.R) controls logic how inputs influence outputs
- R script(s) must be placed in app-specific folder
- RStudio will set all of this up for you if you select
Shiny Web Appfrom theNew Filemenu
ui
fluidPage: renders a webpage that dynamically resizes to fit browser (can also usenavbarPage, which accommodates multiple webpages)titlePanel: page titlesidebarLayout: creates main panel for outputs and sidebar for input widgets (can also usefluidRow/columnto create a custom layout)sidebarPanel: render sidebarsliderInput: widget that collects user input
mainPanel: render main panelplotOutput: render output plot
server
input: list of inputs with names matching widgetinputIdsoutput: list of reactive outputs with names that matchoutputIds ofuioutputs
A simple example
- see here for a more complex example that illustrates many of the features discussed here
library(shiny)
ui <- fluidPage(
  titlePanel("Hello Shiny!"),
  sidebarLayout(
    sidebarPanel(
      sliderInput(inputId = "bins", label = "Number of bins:", min = 1, max = 50, value = 30)
    ),

    mainPanel(
      plotOutput(outputId = "distPlot")
    )
  )
)

server <- function(input, output) {
  output$distPlot <- renderPlot({
    x    <- faithful$waiting
    bins <- seq(min(x), max(x), length.out = input$bins + 1)
    hist(x, breaks = bins, col = "#75AADB", border = "white",
         xlab = "Waiting time to next eruption (in mins)",
         main = "Histogram of waiting times")
    })
}
Additional UI elements:
navbarPageallows inclusion of multipletabPanelelements, each having it’s ownsidePanel/mainPanel(or other layout)- can include
navbarMenuelements, that create drop-down menus with additionaltabPanels
- can include
tabsetPanelallows multipletabPanelelements within amainPanel(sharing the samesidePanel)conditionalPanelallowssidebarPanelelements to change between tabs
navlistPanelis similar totabsetPanel, but the list oftabPanelsis in the sidebar rather than across the top of the main panel (similar to a floating table of contents in a rMarkdown document)conditionalPanelallows different sidebars for each tab- see here for more info about Shiny layout options, or see examples in the Shiny Gallery
- text can be formated using Shiny versions of common html tags
- see here for the full list of input widgets
Additional Server elements:
observecan be used to reactively change the state of a ui widget (eg; update slider based on typed value)observe({ updateSliderInput(session, "pvalue", value = input$typedPval) })reqcan be used prevent rendering output until input has been selectedoutput$Plot1 <- renderPlot({ req(input$geneID) MakePlot(input$geneID , table1) })validatecan be used to raise an error if inputs are incorrectoutput$Plot1<- renderPlot({ validate( need(input$Table1_rows_selected != "", "Please select a row from the table") ) MakePlot(input$Table1_rows_selected , table1) })Useful packages
- DT: render fancy tables using DataTables jquery library
- tables can be searched and sorted by any column
- supports selection of single rows/ranges of rows
- selected row number(s) available as an input
output$Table1 <- DT::renderDataTable({
DT::datatable(table1, caption = 'Big ass table of results')
})
- selected row number(s) available as an input
- shinyBS:
bsCollapsecreates collapsable panelsbsTooltipandbsPopoverto add text popups to input widgets and outputs respectivelybsModalto put output in a popup window
Performance
-
Run as much code as possible server function / render function
-
Use reactive to avoid redoing all processing when some inputs change
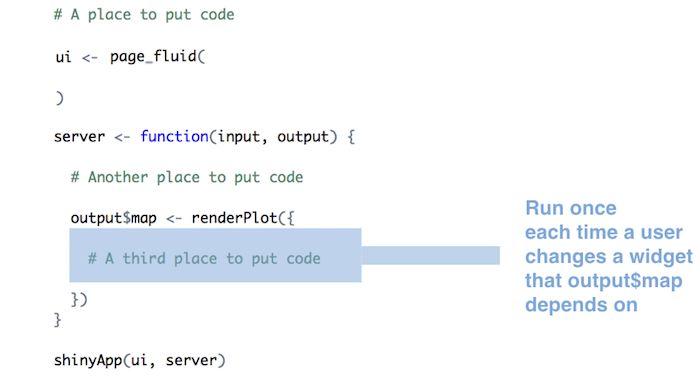
- if an output requires inputs from multiple widgets, it will rerun whenever any of the inputs change
reactivecan be used to store inputs that require a lot of processing- if the other outputs change, the processing in the
reactivefunction will not rerun
dataInput <- reactive({
  getSymbols(input$symb, src = "google",
    from = input$dates[1],
    to = input$dates[2],
    auto.assign = FALSE)
})

output$plot <- renderPlot({
  chartSeries(dataInput(), theme = chartTheme("white"),
    type = "line", log.scale = input$log, TA = NULL)
})
- Use indexing to avoid loading large datasets into memory
- data can be stored in a database and retrieved as needed
- Use external tools (tabix, bedtools, samtools) to index data on disk
- tabix supports bedfiles with arbitrary numbers of columns after three interval columns
genotypes <- system(paste("bcftools view -H -r", snp_pos, "./Data/combined_filtered.vcf.gz"), intern=TRUE) %>%
    str_split('\t')
Deployment
- ShinyApps.io
- deploy with the press of a button within RStudio
- free option that will break quite quickly if your app becomes popular (5 apps/25 hours per month), as well as payed options with higher capacity
- ShinyServer
- locally hosted (specifically, in Mark’s office)
- allows more flexibility to include external tools and databases (though database servers can be accessed from ShinyApps.io)
- GitHub
- requires your audience to have RStudio, but combined with private repos, would allow you to control access
- there is a
runGitHubfunction that allows apps to be run directly from github, but I’m not sure if it would work with a private repo